
Blog
How to Read Lithium Battery Discharge & Charging Curves: The Complete 2026 Guide
2026-05-28 | Calvin
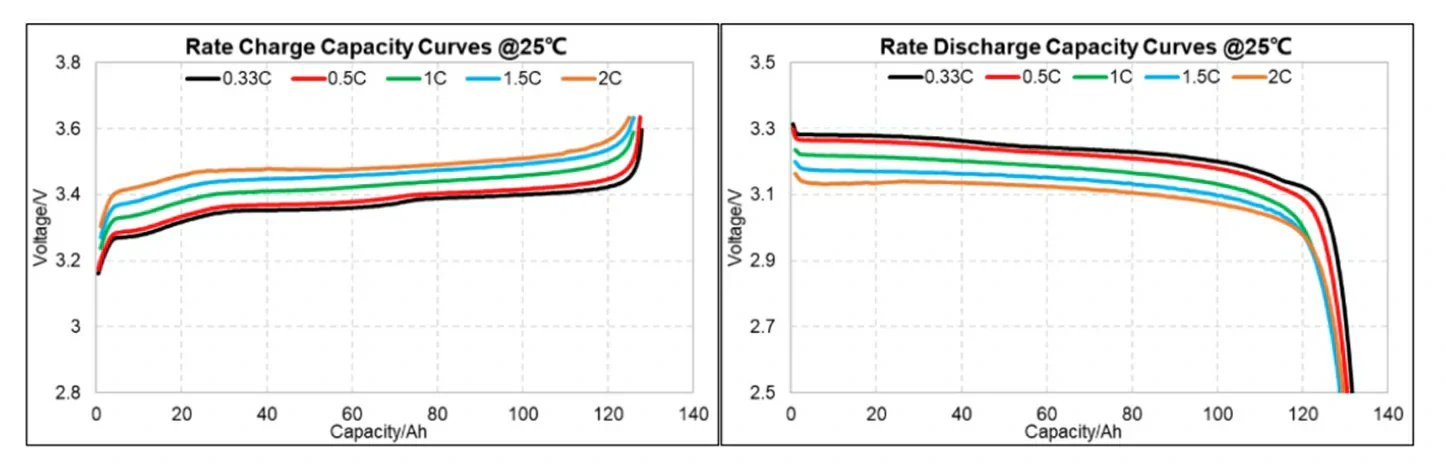
A lithium battery's discharge and charging curves are the closest thing the battery world has to a medical chart — they tell you exactly what is happening inside the cell at every moment of its operating cycle. Voltage, capacity, internal resistance, cycle-aging rate, state of health: all of it is encoded in the shape of these curves.
Most engineers and technically minded battery users have seen these graphs. Far fewer know how to extract the full story from them.
This guide builds that skill systematically. We start with the physics that creates each curve shape, move through a chemistry-by-chemistry comparison of what healthy curves look like, break down how C-rate, temperature, and aging each deform the curve in specific and diagnosable ways, and finish with a practical framework for using curves to diagnose battery health in real systems.
By the end, you'll be able to look at a discharge or charging curve and read it the same way an engineer reads an ECG — not just seeing the line, but understanding what every inflection point, plateau, and slope change actually means.
Part 1: What a Discharge Curve Is — The Physics Behind the Shape
A lithium battery discharge curve plots the battery's terminal voltage on the vertical axis against a measure of discharged capacity (Ah, mAh, or % DoD) on the horizontal axis, at a defined discharge current (C-rate).
The shape is not arbitrary. Every feature of the curve is produced by a specific electrochemical process inside the cell.
The three regions of a discharge curve
Region 1 — Initial voltage drop (0–5% discharged)
When discharge begins, the terminal voltage drops immediately from the open-circuit voltage (OCV) to the load voltage. This instantaneous drop is caused by the battery's internal resistance (ohmic resistance, Ri). A larger Ri produces a larger initial drop. The size of this initial step is one of the most direct visible measures of internal resistance available from a discharge curve — and it is the key metric that changes with battery aging.
Region 2 — The voltage plateau (5–85% discharged, approximately)
The plateau is the flat or gently sloping middle section that makes up the majority of a lithium battery's discharge. This is where the electrochemical reactions are thermodynamically stable — lithium ions are intercalating or deintercalating from the electrode structures at a rate that maintains a near-constant electrochemical potential.
The flatness of the plateau is a chemistry-dependent property. LiFePO4's olivine crystal structure produces an exceptionally flat plateau at approximately 3.2–3.3V per cell — one of the flattest of any rechargeable chemistry. NMC and LCO show a more gradually sloping plateau as their layered oxide structures release energy across a wider electrochemical potential range.
Region 3 — The knee and end-of-discharge drop (85–100% discharged)
As the battery approaches full depletion, the remaining lithium available for reaction decreases sharply, internal resistance spikes, and the terminal voltage drops steeply — this is the "knee" of the curve. The knee marks the point where useful energy delivery is effectively exhausted. In healthy LiFePO4 cells, the knee occurs below approximately 3.0V per cell; below 2.5V per cell, the BMS should have already disconnected the load.
The horizontal position of the knee tells you a great deal. In a new battery, the knee sits far to the right (most capacity is usable before voltage collapses). In an aged battery, the knee migrates left — the voltage collapses earlier, shrinking the usable capacity window.
Part 2: Discharge Curve Types — What Each Version Tells You
Different x-axis choices produce different curve formats, each optimized for a specific type of analysis.
Voltage vs. Capacity (V–Ah or V–mAh)
Most common format. The horizontal axis shows absolute discharged capacity in Ah or mAh. This directly reveals how much usable energy the battery delivers at a defined C-rate. The area under the curve is proportional to total energy delivered (Wh = integral of V × dAh).
Use it for: Capacity verification testing, comparing rated vs. actual capacity, tracking capacity fade over cycle life.
Voltage vs. Time (V–t)
The horizontal axis shows elapsed time. At a constant C-rate, this is equivalent to V–Ah (time scales linearly with capacity). Most useful for visualizing real-time discharge behavior and comparing runtime at different C-rates.
Use it for: Runtime estimation, visualizing how long a battery will power a specific load before voltage drops below the device's cutoff threshold.
Voltage vs. State of Charge (V–SOC)
The horizontal axis shows remaining charge as a percentage (100% = full, 0% = empty). This is the "fuel gauge" format — directly shows voltage as a function of how full the battery is.
Use it for: BMS SOC estimation, building voltage-to-SOC lookup tables, understanding how reliably voltage predicts remaining charge. The extremely flat LiFePO4 plateau makes voltage a poor predictor of SOC in the 20–90% SOC range — a critical design implication for any BMS relying on voltage-based SOC estimation.
Voltage vs. Depth of Discharge (V–DoD)
The inverse of V–SOC: DoD starts at 0% (full) and increases toward 100% (empty). Often used in cycle life testing and system design documentation.
Part 3: Chemistry-by-Chemistry Discharge Curve Comparison
Different lithium chemistries produce fundamentally different curve shapes, with direct implications for system design, BMS strategy, and application suitability.
| Chemistry | Nominal Cell V | Plateau Flatness | End-of-discharge V | Curve Shape |
|---|---|---|---|---|
| LiFePO4 (LFP) | 3.2 V | Very flat (±0.1V over 80% DoD) | 2.5 V | Near-horizontal plateau, abrupt knee |
| NMC (Nickel Manganese Cobalt) | 3.6–3.7 V | Moderate slope | 3.0 V | Gradual continuous decline |
| LCO (Lithium Cobalt Oxide) | 3.6 V | Steep slope | 3.0 V | Steep, S-shaped decline |
| LMO (Lithium Manganese Oxide) | 3.8 V | Flat with step | 3.0 V | Two-step plateau |
| LTO (Lithium Titanate) | 2.4 V | Very flat | 1.5 V | Near-horizontal, similar to LFP |
LiFePO4 discharge curve in detail
LiFePO4 exhibits a discharge curve unlike any other mainstream lithium chemistry. LiFePO4 cells exhibit a relatively flat voltage plateau for most of the discharge cycle, around 3.2 to 3.3V, which allows consistent power output and easier voltage regulation.
This flatness is not an accident — it is the thermodynamic consequence of the two-phase reaction mechanism inside the LiFePO4 cathode. During discharge, two crystal phases coexist (lithium-rich FePO4 and lithium-poor FePO4), and as long as both phases are present, the electrochemical potential — and thus the voltage — remains nearly constant. Only when one phase is exhausted does the voltage change rapidly, producing the characteristic abrupt knee.
Practical implication for system designers: The flat LiFePO4 plateau means voltage is a very poor predictor of remaining capacity in the 20–90% SOC range. A 12V LiFePO4 battery at 90% SOC reads approximately 13.2V at rest; at 20% SOC it reads approximately 13.0V — only a 0.2V difference across 70% of the capacity range. BMS designs that rely on voltage-only SOC estimation are fundamentally inaccurate with LFP chemistry; coulomb counting (tracking current flow) is essential.
NMC discharge curve in detail
NMC batteries display a more gradual voltage decline from about 4.2V down to around 3.0V, indicating the gradual depletion of stored energy. This slope makes NMC voltage a more reliable predictor of SOC than LFP, simplifying BMS design. The tradeoff is that the sloping profile means load voltage changes continuously through discharge, which some devices handle less gracefully than the flat LFP output.
Why the plateau shape matters for your application
If your load is voltage-sensitive (electronics with tight supply rails, certain motor controllers): LFP's flat output voltage is a significant advantage — the load sees near-constant voltage for 80% of the discharge cycle.
If your BMS relies primarily on voltage for SOC estimation: NMC's sloped profile is more accommodating; LFP requires dedicated coulomb counting.
If your application prioritizes energy density over stability: NMC's higher nominal voltage and greater slope deliver more energy per kilogram in applications where weight matters.
Part 4: How C-Rate Deforms the Discharge Curve — Reading Rate Effects
The C-rate (discharge rate expressed as a multiple of rated capacity) is one of the most visible influences on discharge curve shape. Understanding C-rate effects lets you read a curve and immediately understand the load conditions it was measured at.
The mechanism: why higher C-rates lower the curve
When current flows through a battery, it must overcome the internal resistance Ri. The voltage the load actually sees is:
V_terminal = V_OCV − (I × Ri)
Where V_OCV is the open-circuit voltage, I is the discharge current, and Ri is the internal resistance. At higher C-rates, I is larger, so the (I × Ri) term becomes larger, pulling the entire curve downward.
Additionally, at high discharge rates, ion diffusion inside the electrode cannot keep pace with demand — a phenomenon called polarization — which causes additional transient voltage depression beyond the simple ohmic drop.
C-rate effects by region
Initial drop (Region 1): Larger and more visible at high C-rates. The instantaneous voltage drop on applying load is proportional to current × Ri.
Plateau (Region 2): Shifts downward proportionally to the C-rate. A LiFePO4 cell with a 3.25V plateau at 0.1C might show a 3.10V plateau at 1C and a 2.95V plateau at 3C — while the chemistry is identical. The plateau also shortens at high C-rates because some capacity becomes electrochemically inaccessible at high discharge rates.
Knee (Region 3): Migrates left at high C-rates — the usable capacity ends sooner before the voltage collapses. This is sometimes called apparent capacity loss at high C-rates. It is not true permanent capacity loss; the capacity is recoverable at lower C-rates.
Practical C-rate curve reading
| C-Rate | Curve Position | Usable Capacity | Heat Generation | Typical Application |
|---|---|---|---|---|
| 0.1C | Highest (most accurate) | ~100% of rated | Minimal | Lab testing, reference measurements |
| 0.2C–0.5C | Near-rated | 95–100% | Low | Solar, RV, daily storage cycling |
| 1C | Slightly depressed | 90–95% | Moderate | Normal EV, power tool operation |
| 2C | Noticeably depressed | 80–90% | Significant | Fast discharge, high-power loads |
| 3C+ | Significantly depressed | 70–85% | High | Peak power events, motor startup |
Key insight for real-world battery sizing: When a manufacturer rates a battery as "100Ah," that rating is typically measured at a low C-rate (0.1C or 0.2C) at 25°C. Under real operating conditions at 1C or above, the usable capacity will be somewhat less — an important consideration for system sizing.
Part 5: Temperature Effects on the Discharge Curve
Temperature changes the internal resistance of a lithium battery — and therefore changes everything that depends on internal resistance: the initial voltage drop, the plateau height, the position of the knee, and the effective usable capacity.
Cold temperature effects on the discharge curve
At low temperatures, two things happen simultaneously: ionic mobility in the electrolyte decreases (slowing lithium-ion transport), and the SEI layer resistance at the anode increases. Both effects raise internal resistance, depressing the discharge curve.
The practical effects:
- Curve shifts downward: The plateau voltage drops as Ri increases, even though the underlying electrochemical energy content is unchanged
- Knee migrates left: More capacity becomes electrochemically inaccessible at low temperatures because diffusion limitations prevent full utilization before voltage cutoff is reached
- Usable capacity decreases: At -10°C, a LiFePO4 battery may deliver only 80–85% of its 25°C capacity. At -20°C, this falls to approximately 60%
At temperatures below 0°C, the discharge curve can still look normal in shape — the plateau is simply lower. This is why temperature data must accompany discharge curves for accurate interpretation; a depressed curve can indicate either high C-rate, low temperature, high internal resistance from aging, or some combination.
High temperature effects on the discharge curve
Elevated temperatures reduce electrolyte resistance and improve ion mobility, which raises the plateau voltage slightly and shifts the knee rightward — the battery delivers more capacity per cycle. This is why discharge curves measured at 45°C show higher "capacity" than those at 25°C.
However, high temperature accelerates every degradation reaction simultaneously. The short-term gain in apparent capacity comes at the cost of accelerated aging — a trade-off clearly visible when comparing discharge curves of the same cell after 500 cycles at 25°C vs. 500 cycles at 45°C. The higher-temperature cell will show more curve degradation (lower plateau, earlier knee) despite having shown higher capacity per cycle during operation.
Part 6: Reading Internal Resistance from the Discharge Curve
Internal resistance (Ri) is one of the most important battery health parameters — and it can be estimated directly from discharge curve behavior without specialized impedance measurement equipment.
Method 1: The initial voltage step method
When a load is applied to a resting battery, the terminal voltage drops instantaneously from the open-circuit voltage (OCV) to the loaded voltage. This instantaneous drop is almost entirely caused by ohmic resistance (Ri):
Ri ≈ ΔV_initial / I_discharge
Where ΔV_initial is the magnitude of the instantaneous voltage drop and I_discharge is the applied current.
Example: A 100Ah LiFePO4 battery at 50% SOC has an OCV of 3.28V per cell. When a 50A load is applied (0.5C), the terminal voltage drops immediately to 3.22V. ΔV = 0.06V, I = 50A. Ri ≈ 0.06 / 50 = 1.2 mΩ per cell. A healthy 100Ah LFP cell should have Ri below 1.5–2.0 mΩ; values above 3–4 mΩ indicate aging or damage.
Method 2: Comparative curve position shift
By comparing discharge curves at two different C-rates measured under identical temperature and SOC conditions, the internal resistance can be estimated from the vertical offset between the curves:
Ri ≈ (V_plateau_low_rate − V_plateau_high_rate) / (I_high − I_low)
What increasing Ri looks like across a curve series
In a healthy new battery: discharge curves at 0.5C and 1C are closely spaced (small Ri).
In an aged battery: the same C-rate curves are widely separated — the 1C curve is much lower than the 0.5C curve — indicating Ri has increased substantially. The battery has not lost as much capacity as the high-rate curve suggests; the apparent capacity loss is partly the result of increased ohmic voltage drop cutting off discharge prematurely.
Internal resistance increases as batteries age, and this increase leads to higher heat generation and a noticeable decline in performance. Tracking the curve separation over time is a reliable, non-invasive method of monitoring battery health in the field.
Part 7: The Lithium Battery Charging Curve — The Three-Phase Structure
The charging curve is the mirror process to discharge — but it is not simply a reversed discharge curve. The charging protocol is actively managed by the charger to protect the cells, and the curve shape reflects that management.
Phase 1: Pre-charge (optional trickle phase)
If the battery is deeply discharged below a safe minimum voltage (typically below 2.5V per cell for LFP, 3.0V for NMC), many chargers apply a very low pre-charge current (0.05C–0.1C) to safely bring the cell voltage up before applying full current. At very low voltages, cells are vulnerable to lithium plating and internal damage under high currents; the pre-charge phase is a protective slow-walk back to safe operating voltage.
On the charging curve: this appears as a slowly rising voltage segment at very low SOC before the main CC phase begins.
Phase 2: Constant Current (CC) Phase
This is the bulk charging phase — the charger delivers a fixed current (typically 0.5C–1C) while voltage rises steadily. This phase delivers approximately 70–80% of the total charge.
What the curve shows: Voltage rises at a rate determined by the internal resistance and the electrochemical dynamics of lithium intercalation. The steepness of the rising portion reflects both the C-rate and the cell's internal resistance — a higher Ri produces a steeper initial voltage rise at the same current because the voltage "leads" the actual SOC due to the Ri × I offset.
Key voltage milestones during CC:
- LiFePO4: voltage rises from ~3.0V to the upper cutoff of 3.65V per cell
- NMC: rises from ~3.0V to upper cutoff of 4.2V per cell
- The rate of rise accelerates as the cell approaches full charge — the curve steepens noticeably in the top 10–15% of SOC
Phase 3: Constant Voltage (CV) Phase
Once the cell voltage reaches the maximum charge voltage (3.65V/cell for LFP; 4.2V/cell for NMC), the charger switches from current control to voltage control. It holds the voltage constant at this value while the current tapers exponentially toward zero.
What the curve shows: Voltage is flat (held by the charger). Current (on the secondary y-axis if plotted) decays in an approximately exponential shape. The tapering current is the diagnostic indicator of how full the battery actually is — the charger is pushing the last portion of charge in as the cell's electrochemical resistance to further charging increases.
Charge termination typically occurs when the tapering current falls below a threshold, commonly 0.05C (5% of the rated capacity in amps). For a 100Ah battery, termination at 5A.
Why CV phase matters for battery health: Allowing the CV phase to complete fully ensures the cells are fully balanced. Consistently stopping charge during the CC phase (at, say, 90–95% SOC) reduces stress and extends cycle life, but means the BMS's cell balancing function — which operates near top-of-charge where cell voltage differences are most measurable — has less opportunity to work. For multi-cell packs, occasionally charging to 100% (full CV completion) is important for cell balance maintenance even if routine operation is kept to 80–90%.
Phase 4: Float/Trickle (maintenance charging, some applications)
Standby applications (UPS, backup systems) may enter a float phase after CV charging completes — a very low maintenance current that compensates for self-discharge and holds the battery at full charge indefinitely. LiFePO4's self-discharge rate of 1–3% per month means float current can be minimal.
Note: For cycling applications (solar, EVs, daily use), float charging is generally not used — the battery is charged, disconnected, and discharged in a continuous cycle.
Part 8: LiFePO4 vs. NMC Charging Curves — Key Differences
| Parameter | LiFePO4 (LFP) | NMC |
|---|---|---|
| CC phase charge voltage range | 3.0V → 3.65V per cell | 3.0V → 4.2V per cell |
| CV phase hold voltage | 3.65V per cell | 4.2V per cell |
| Typical charge cutoff current | 0.05C | 0.05C |
| Sensitivity to overcharge | Moderate (tolerates brief overcharge better than NMC) | High (significant degradation above 4.25V/cell) |
| Cold temperature charge restriction | Below 0°C: stop charging | Below 0°C: significantly restrict current |
| Voltage rise rate during CC | Slow/flat until near full (olivine phase transition) | Gradual and consistent throughout |
| SOC estimation from charge curve | Difficult (flat V vs. SOC) | Easier (sloped V vs. SOC) |
The most important difference for system design: LiFePO4 is substantially more tolerant of overcharge than NMC — but not immune. A charger configured for NMC at 4.2V/cell will destroy LFP cells (rated to 3.65V/cell). Always verify charger chemistry compatibility before connecting.
Part 9: Using Discharge Curves to Diagnose Battery State of Health (SOH)
This is where curve analysis moves from academic to practically valuable. By tracking how a battery's discharge curve evolves over its service life, you can diagnose degradation type, estimate remaining capacity, and predict when replacement is needed — all without destructive testing.
The four aging signatures visible in discharge curves
Signature 1 — Downward plateau shift (increased Ri)
The plateau voltage drops over successive cycles while curve shape and capacity remain roughly similar. This indicates increased internal resistance — the primary aging mechanism in most LFP applications. The battery still holds charge well; it just loses more voltage to internal resistance under load. Visible as a uniform downward translation of the entire curve.
Diagnosis: Ri increase. Battery still functional but efficiency declining. Monitor closely.
Signature 2 — Shortened curve (capacity fade)
The curve maintains its plateau height and shape but terminates earlier — the knee appears at a lower discharged capacity value. This indicates loss of active lithium or loss of active material — capacity has genuinely decreased, not just voltage-depressed by resistance.
Diagnosis: True capacity fade. Usable energy has decreased. If below 80% of original rated capacity, battery is at conventional "end of first life."
Signature 3 — Leftward knee migration (combined Ri + capacity)
Both effects together: the curve is lower AND shorter. Most commonly seen in batteries that have experienced thermal stress, chronic overcharge, or very high C-rate operation.
Diagnosis: Advanced aging. Both capacity and power delivery are compromised. Plan replacement.
Signature 4 — Plateau fragmentation or irregularities
The plateau shows bumps, steps, or irregularities that weren't present in earlier cycle data. In multi-cell packs, this often indicates cell imbalance — one or more cells hitting cutoff prematurely and causing the BMS to limit the entire pack's discharge.
Diagnosis: Cell imbalance or individual cell failure in a series pack. Run a cell-level capacity test to identify the weak cell.
SOH calculation from capacity fade
The most straightforward SOH metric derived from discharge curves:
SOH (%) = (Measured discharge capacity at defined C-rate and temperature) / (Original rated capacity at same conditions) × 100
A battery with an original rating of 100Ah that now delivers 87Ah under identical test conditions has an SOH of 87%. Industry convention treats 80% SOH as end of first life.
Part 10: Practical Applications — Reading Curves in Real Systems
Solar energy storage: interpreting daily cycle data
In a properly instrumented solar system, each day's discharge cycle generates an implicit discharge curve (voltage vs. SOC over time). Comparing daily curves over weeks and months is one of the most practical, non-invasive battery health monitoring approaches available:
- Consistent plateau height day over day → battery is healthy
- Plateau gradually lowering over months → normal aging / slight Ri increase
- Sudden plateau drop or premature knee → investigate for cell imbalance, temperature event, or charging fault
Electric vehicle battery packs: using curve shifts for pack management
EV battery management systems continuously construct internal discharge models from operating data. When the pack's modeled discharge curve deviates significantly from its reference (the as-new baseline), the BMS flags degradation and adjusts capacity estimates, range estimates, and charge limits accordingly.
The principle is the same as manual curve comparison — the BMS is simply doing it algorithmically in real time.
Acceptance testing: verifying new batteries meet specification
A new battery claiming 100Ah should be tested with a full constant-current discharge at 0.2C from 100% to the rated cutoff voltage. The resulting discharge curve should:
- Show a plateau at or above the rated nominal voltage
- Deliver ≥ 100Ah before reaching cutoff
- Show an initial voltage drop consistent with claimed internal resistance
A battery whose discharge curve shows a plateau significantly below nominal voltage, or which delivers materially less than rated capacity, has either been misrated, degraded during shipping/storage, or contains lower-grade cells than specified.
Frequently Asked Questions
- What does a healthy LiFePO4 discharge curve look like?
- A healthy LiFePO4 discharge curve shows three regions: a small initial voltage drop when load is applied (reflecting low internal resistance), a long, near-horizontal plateau at approximately 3.2–3.3V per cell that extends through roughly 80% of the discharge, and then an abrupt knee where voltage drops steeply toward the 2.5V per cell cutoff. The plateau should be very flat — deviations greater than 0.1–0.15V across the plateau region suggest elevated internal resistance or high C-rate effects.
- Why is the LiFePO4 discharge curve so flat?
- The extraordinary flatness of the LiFePO4 discharge plateau is caused by its two-phase reaction mechanism. During discharge, two crystal phases of the cathode material — lithium-rich and lithium-poor — coexist. Thermodynamically, the voltage is determined by the Gibbs free energy of the phase transition, which remains nearly constant as long as both phases are present. The voltage only changes significantly when one phase is fully consumed, producing the abrupt knee at end of discharge.
- Why does a battery at high C-rate appear to have less capacity?
- At high discharge rates, the terminal voltage is depressed by the product of current × internal resistance (I × Ri). When terminal voltage hits the cutoff threshold sooner — before all electrochemical energy has been extracted — the apparent capacity is lower. This is not permanent capacity loss. The same energy remains available at lower C-rates. This phenomenon is described by Peukert's Law, which quantifies how apparent capacity decreases with increasing discharge rate. It is why manufacturer capacity specifications must always be read alongside their specified test C-rate.
- What is the difference between the CC and CV phases of charging?
- During the Constant Current (CC) phase, the charger delivers a fixed current while the battery voltage rises. This phase delivers the bulk of the charge (roughly 70–80%) quickly. During the Constant Voltage (CV) phase, the charger holds voltage at the cell's maximum charge voltage while current tapers toward zero. This phase completes the charge slowly and safely, preventing overcharge. Both phases are necessary — CC alone would overcharge the battery; CV alone would charge it very slowly from any starting point.
- How can I estimate internal resistance from a discharge curve?
- Apply a known load current and measure the instantaneous voltage drop from the open-circuit voltage to the loaded terminal voltage when discharge begins. Divide the voltage drop by the current: Ri ≈ ΔV / I. For example, a 0.06V drop when applying a 50A load gives Ri = 0.06 / 50 = 1.2 mΩ. Alternatively, compare plateau voltage at two different C-rates and divide the plateau offset by the current difference. Both methods give a reasonable estimate of ohmic resistance; full impedance spectroscopy is needed for complete resistance decomposition.
- How do I know if a battery is aging by looking at its discharge curve?
- Compare current discharge curves against the battery's baseline (ideally the as-new reference curve at the same C-rate and temperature). Four aging signatures to look for: (1) downward plateau shift without capacity loss indicates increasing internal resistance; (2) shortened curve with the knee migrating left indicates true capacity fade; (3) both effects together indicate advanced aging; (4) irregular bumps or steps in the plateau (in multi-cell packs) indicate cell imbalance. Any of these compared against a known baseline gives a clear, quantitative picture of battery health.
- Does temperature affect the charging curve as well as the discharge curve?
- Yes, significantly. At low temperatures, higher internal resistance means the cell voltage rises faster during CC charging (the charger sees a higher terminal voltage sooner because of the Ri × I offset), which can prematurely trigger the CV phase transition before the cell is actually at the target SOC. This results in undercharging — the battery appears full but is actually only 70–80% charged. It is one of the reasons charging below 0°C is prohibited for LiFePO4 without active heating: not only does it risk lithium plating, but even successful cold charging results in incomplete charge acceptance.
Conclusion
Battery discharge and charging curves are not just academic plots — they are diagnostic instruments that encode the complete functional state of the cell in graphical form. The voltage plateau height tells you about internal resistance. The plateau length tells you about capacity. The plateau shape tells you the chemistry. The position of the knee tells you about aging state. The CC/CV transition tells you about the charger's interaction with the cell's electrochemistry.
Developing the ability to read these curves fluently transforms battery management from guesswork into engineering. Whether you are accepting a new battery shipment, monitoring a solar system over years of service, analyzing EV pack degradation, or designing a charging protocol for a custom application — the curves tell you what you need to know. The skill is learning the language.
- Next:How Long Do LiFePO4 Batteries Last? Lifespan, Cycle Life & Extension Tips
- Previous:What Is the Fire Temperature Range of Lithium-Ion Batteries
Contact Details
Lithium LiFePO4 Batteries and Lithium LiFePO4 Cells Supplier - LiFePO4 Battery Shop
Contact Person: Miss. Elena Wang
WhatsApp : +8615263269227
Skype : +8615263269227
WeChat :15263269227
Email : info@lifepo4batteryshop.com
All Products
- TC Elcon Charger (0)
- Headway Lithium Battery (6)
- Blade Battery (10)
- Semi Solid State Battery (6)
- A123 Battery (6)
- Sinopoly Battery (7)
- GBS Battery (16)
- CALB Battery (25)
- Cylindrical Cell (9)
- Energy Storage System (0)
- Battery Management System (15)
- Sodium ion Battery Cell (4)
- Lithium Titanate Battery (22)
- Ternary Lithium Battery Cell (12)
- REPT Battery (10)
- BYD Battery (5)
- CATL Battery (15)
- Thunder Sky Winston Battery (26)
- EVE Battery (35)
- LiFePO4 Battery Cell (20)
Certification



Customer Reviews
- I have fond memories of our meeting in Shanghai with LiFePO4 Battery Shop Elena. Your company left a strong impression on me with its impressive growth and professionalism. We both value straightforwardness and honesty, which I believe are the most important qualities in any partnership. I am confident that we can build a successful collaboration based on these shared values. —— Robert from USA
- I've been working with LiFePO4 Battery Shop for years, and their reliability is unmatched. While other suppliers frequently change sales teams, LiFePO4 Battery Shop has consistently provided exceptional service with a stable team. Their commitment to quality and customer support truly sets them apart. —— Henry from Australia